> ## Documentation Index
> Fetch the complete documentation index at: https://koreai-agent-management-platform-dev.mintlify.app/llms.txt
> Use this file to discover all available pages before exploring further.
# Performance Dashboard
[Back to Analytics Overview](/ai-for-service/analytics/overview)
The Performance Dashboard provides insights into your AI Agent's NLP performance and integration metrics after it is published.
To view the Performance Dashboard:
1. Click **Analytics** on the left navigation pane. The Analytics panel opens with the list of reports.
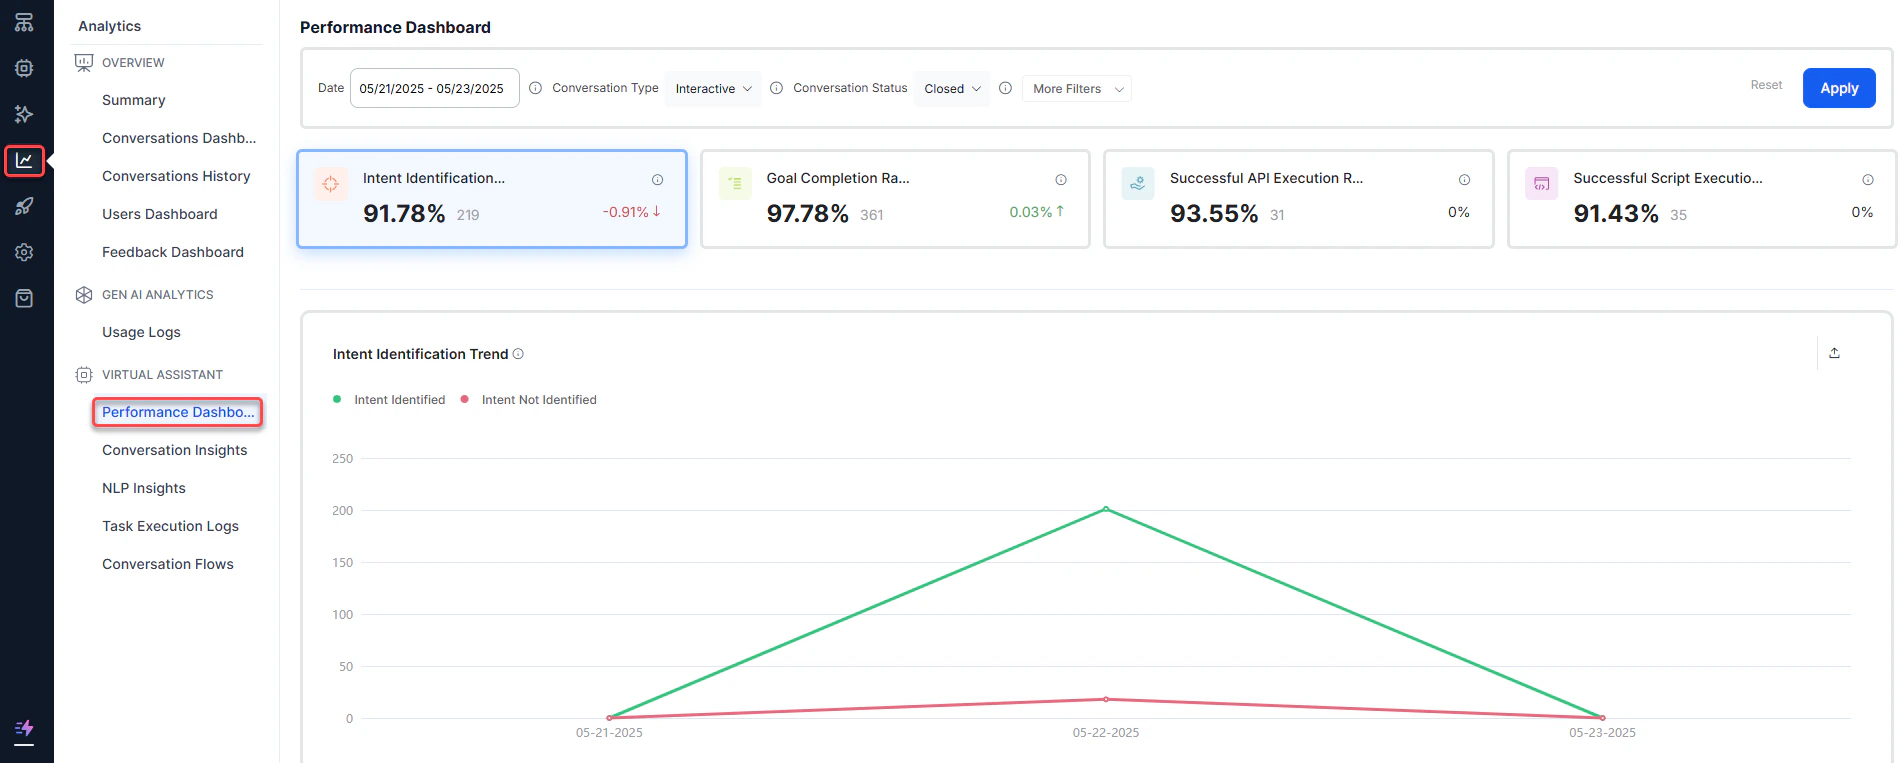 2. Click **Performance Dashboard** under the **Automation** section of the Analytics panel.
3. Select appropriate filters and click **Apply**.
2. Click **Performance Dashboard** under the **Automation** section of the Analytics panel.
3. Select appropriate filters and click **Apply**.
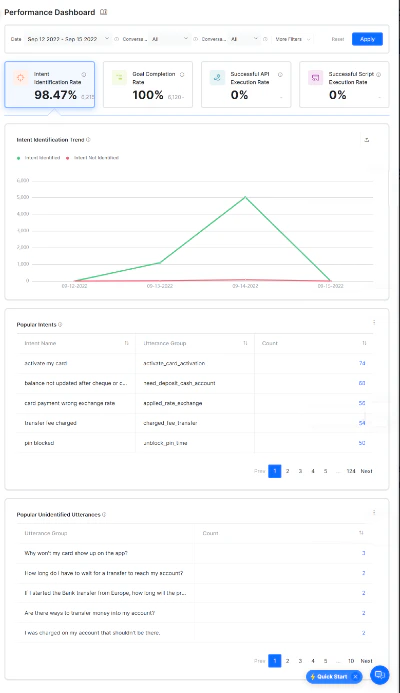 ***
## Performance Dashboard Metrics
The Performance Dashboard is organized into four categories to identify how an AI Agent performs.
### Intent Identification Rate
This section provides information on the number of intents that were classified and unclassified. An intent represents the goal the customer has in mind when typing a question or comment — it is "what they really mean."
| Metric | Description |
| ------------------------------- | ---------------------------------------------------------------------------------------------------------------------------------------------------------------------------------------------------------------------------------------------------------------------------------------------------------------------------------------------------------------------- |
| Intent Identification Rate | A scorecard showing the percentage and number of intents identified in a duration, along with the percentage increase or decrease from the last selected period. |
| Intent Identification Trend | A line chart showing total classified vs. unclassified intents over a period of time. |
| Popular Intents | A table with the number of times the AI Agent identified a given intent from user utterances in active and closed conversations. Fields include **Intent Name**, **Utterance Group** (the cluster of similar utterances), and **Count**. Clicking an intent name displays a drill-down view of relevant utterances, channel, user ID, date and time, and chat history. |
| Popular Unidentified Utterances | A table showing utterances that did not result in an intent identification, grouped by similarity. |
### Goal Completion Rate
This section shows how many tasks the AI Agent completes and fails within a selected time. Failed tasks include both abandoned and incomplete tasks. Tasks include any interaction such as Dialog, FAQs, or alerts.
| Metric | Description |
| ---------------------- | ------------------------------------------------------------------------------------------------------------------------------------------------------------------------------------ |
| Goal Completion Rate | A scorecard showing the percentage and number of task executions successfully completed in a duration, along with the percentage increase or decrease from the last selected period. |
| Goal Completion Trend | A line chart plotting successful and failed task executions over time. |
| Task Performance | A table providing the number of successful and failed task executions per task for a selected duration. |
| Failure Point Analysis | A table showing the number of times a task has failed at various nodes. |
### API Execution Rate
This section provides information on the number of APIs that were successfully executed and failed. Dialog tasks often use a Service node to make REST or SOAP requests to third-party web services.
| Metric | Description |
| ----------------------- | ------------------------------------------------------------------------------------------------------------------------------------------------------------------- |
| API Performance Rate | A scorecard showing the percentage and number of service calls executed successfully, along with the percentage increase or decrease from the last selected period. |
| Service Execution Trend | A line chart plotting the trend of successful and failed service executions over time. |
| Service Performance | A table showing the number of times a service node is executed, its status, and the average response time. |
### Script Execution Rate
This section provides information on the number of scripts that were successfully executed and failed. A Script node allows you to write JavaScript code in a dialog task.
| Metric | Description |
| ----------------------- | ------------------------------------------------------------------------------------------------------------------------------------------------------------- |
| Script Performance Rate | A scorecard showing the percentage and number of scripts executed successfully, along with the percentage increase or decrease from the last selected period. |
| Script Execution Trend | A line chart plotting the trend of successful and failed script executions over time. |
| Script Performance | A table showing the number of times a script node is executed, its status, and the average response time. |
***
## Filter Criteria
The Performance Dashboard data can be filtered using specific criteria. Learn more.
Built with [Mintlify](https://mintlify.com).
***
## Performance Dashboard Metrics
The Performance Dashboard is organized into four categories to identify how an AI Agent performs.
### Intent Identification Rate
This section provides information on the number of intents that were classified and unclassified. An intent represents the goal the customer has in mind when typing a question or comment — it is "what they really mean."
| Metric | Description |
| ------------------------------- | ---------------------------------------------------------------------------------------------------------------------------------------------------------------------------------------------------------------------------------------------------------------------------------------------------------------------------------------------------------------------- |
| Intent Identification Rate | A scorecard showing the percentage and number of intents identified in a duration, along with the percentage increase or decrease from the last selected period. |
| Intent Identification Trend | A line chart showing total classified vs. unclassified intents over a period of time. |
| Popular Intents | A table with the number of times the AI Agent identified a given intent from user utterances in active and closed conversations. Fields include **Intent Name**, **Utterance Group** (the cluster of similar utterances), and **Count**. Clicking an intent name displays a drill-down view of relevant utterances, channel, user ID, date and time, and chat history. |
| Popular Unidentified Utterances | A table showing utterances that did not result in an intent identification, grouped by similarity. |
### Goal Completion Rate
This section shows how many tasks the AI Agent completes and fails within a selected time. Failed tasks include both abandoned and incomplete tasks. Tasks include any interaction such as Dialog, FAQs, or alerts.
| Metric | Description |
| ---------------------- | ------------------------------------------------------------------------------------------------------------------------------------------------------------------------------------ |
| Goal Completion Rate | A scorecard showing the percentage and number of task executions successfully completed in a duration, along with the percentage increase or decrease from the last selected period. |
| Goal Completion Trend | A line chart plotting successful and failed task executions over time. |
| Task Performance | A table providing the number of successful and failed task executions per task for a selected duration. |
| Failure Point Analysis | A table showing the number of times a task has failed at various nodes. |
### API Execution Rate
This section provides information on the number of APIs that were successfully executed and failed. Dialog tasks often use a Service node to make REST or SOAP requests to third-party web services.
| Metric | Description |
| ----------------------- | ------------------------------------------------------------------------------------------------------------------------------------------------------------------- |
| API Performance Rate | A scorecard showing the percentage and number of service calls executed successfully, along with the percentage increase or decrease from the last selected period. |
| Service Execution Trend | A line chart plotting the trend of successful and failed service executions over time. |
| Service Performance | A table showing the number of times a service node is executed, its status, and the average response time. |
### Script Execution Rate
This section provides information on the number of scripts that were successfully executed and failed. A Script node allows you to write JavaScript code in a dialog task.
| Metric | Description |
| ----------------------- | ------------------------------------------------------------------------------------------------------------------------------------------------------------- |
| Script Performance Rate | A scorecard showing the percentage and number of scripts executed successfully, along with the percentage increase or decrease from the last selected period. |
| Script Execution Trend | A line chart plotting the trend of successful and failed script executions over time. |
| Script Performance | A table showing the number of times a script node is executed, its status, and the average response time. |
***
## Filter Criteria
The Performance Dashboard data can be filtered using specific criteria. Learn more.
Built with [Mintlify](https://mintlify.com).